By using gold as a currency, we can value the price of crude oil price using the oil gold ratio. This ratio is independent of the US dollar and the unreliable CPI measure of inflation. The oil gold ratio suggests oil is evenly priced at the moment.
Does the oil gold ratio support the arguments of those who claim gold is in a bubble? If so, we would expect gold to have outperformed oil substantially over the last decade. Yet the evidence does not support this thesis, as the charts below will show.
Importance of the Oil Gold Ratio
Crude oil is perhaps the most important commodity in western economies today. Changes in its price quickly feed through into government CPI measures, leading to shifts in monetary policy that have a deep impact on the economy. With the traditional CPI measure of such limited value when it comes to measuring inflation, the oil gold ratio becomes an important measure for valuing oil.
The chart below represents the Brent crude oil price in gold ounces rather than U.S. dollars. We have begun the analysis from 1976 as both oil and gold prices have been fixed by the U.S. government in the past.
Brent Crude Oil Priced in Gold

Oil in Gold: 1976-2012
Oil has traded in a range between 0.16 (maximum) and 0.04 (minimum) of an ounce of gold over the period in question. The average value of the oil gold ratio has been 0.075 ounces of gold. By coincidence, this is around where oil is currently trading and so we can say that oil is evenly priced in terms of gold.
It seems that since the year 2000, oil has become more expensive, priced in gold. Even though oil currently looks fairly priced, it’s at the bottom of its range over the last 10 years. Could there have been a permanent shift upwards in the oil gold ratio over the last 10 years, suggesting that oil is actually cheap?
Is Gold in a Bubble?
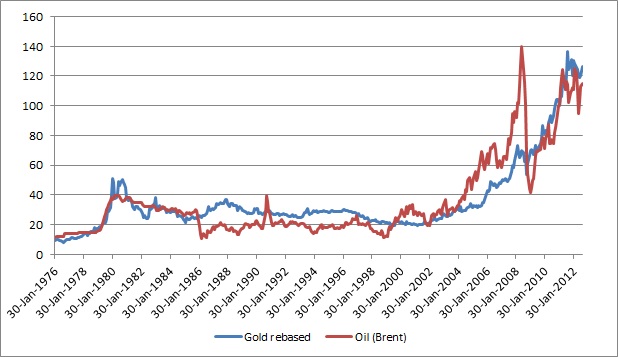
We can also work backwards and consider if gold is grossly overvalued from the oil gold ratio. The next chart shows the prices of gold and oil over the 1976-2012 period. I have re-based gold by the average factor of 0.075 to reflect its average price relative to oil over the period. So when the re-based gold price goes above the oil price, it means the current gold price is higher than average and vice versa.

Oil and Re-based Gold: 1976-2012
We see a tight alignment between the two commodities during the period in question. Gold actually began to lag behind oil, particularly in the early 2008, when the oil price shot up to $150 per barrel. The run up in the price of oil was followed by a swift collapse down to $40.00 per barrel as reflected in the charts. Since that time, oil has tracked around its average price in gold.
There is no basis in relative prices to suggest gold is currently in a bubble. To maintain that argument, one would need to suggest that the whole commodities complex is in a bubble, given that they have tracked each other up in price.
Conclusion
The oil gold ratio looks very much within its normal historical range. However, in terms of oil’s price in gold over the last 10 years, oil is looking cheap. This would be consistent with the price of other cyclical commodities such as platinum, which are at all-time lows priced in gold.
Meanwhile, the proponents of a gold bubble need to explain why other commodities, including oil, have gone up in line with the price of gold over the last decade. Could it be that government controlled fiat currencies have been steadily devalued over the last decade, as reflected by the upward move in ALL commodity prices? I certainly think this is the most probable answer.