Investment Timing

It’s often said that timing-the-market is ‘impossible’. I’ll admit, it’s certainly a challenge as the determining factor is the unpredictable actions of central banks. However, the potential value add through correct investment timing is huge. Asset allocation decisions are widely recognised to be THE predominant driver of investment performance. So how can you stay on top of the area?

One of the best methods of investment timing is through examination of the yield curve. Central banks tend to swing between periods of tightening and loosening, depending on their outlook for price inflation and growth. Ultimately, these actions drive markets AND your investment performance over the medium term. You can infer the current point in the market cycle through the shape of the yield curve and structure investments accordingly.

The value added through insightful investment timing is huge and literally has the potential to transform your portfolio return. Yield curve analysis is a critical investment timing tool along with examination of central bank policy. I have constructed a number of country yield curves below to aid your timing decisions. Some of these are not widely available on the internet and are thus highly value additive to investing decisions.

Aug 312012
 
The Japanese Yield Curve

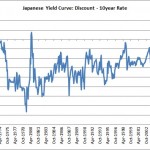
The Japanese yield curve reveals the true state of Japanese monetary policy over the last 20 years. Has it really been ultra loose as suggested by the low short-term rate or more moderate? Examination of the Japanese yield curve also has implications for the West. Is the West following the same policies as Japan and [...]

Aug 292012
 
The US Yield Curve: Canary in the Coalmine

As the USA is the biggest economy in the world; the US yield curve is an important indicator of economic conditions that needs to be monitored carefully. The US yield curve shows us how relaxed monetary policy currently is. We can infer from this the likely path of asset markets. Examining the US yield curve [...]

May 012012
 
The Global Yield Curve

The global yield curve reveals why the 2008 recession was so bad, why the 2009 recovery was so pronounced and the outlook for 2012 and beyond. Aggregating individual country yield curves reveals a more complete picture of the true state of the global economy than looking at individual yield curves alone.

Apr 012012
 
Is the Chinese Yield Curve Driving Gold Prices

We sometimes miss the bigger picture, when we focus solely on the U.S. economy. This certainly seemed like the case in 2011, when precious metals corrected sharply in the second half of the year, despite a new U.S. easing effort in the form of ‘operation twist’. In particular, we can take our eye off the Chinese economy, which I shall examine below by looking at the Chinese yield curve.