By re-basing the S&P 500 in gold, we see the true magnitude of the equity cycle over the last 80 years. Although the dollar based series is volatile, the true size of swings in the S&P 500 has been masked by movements in the dollar.
The current equity bear market began in 2000 and still has room for a further fall, based on previous cycles. It will only be brought to an end through a renewal of the entrepreneurial zeal of the early 1980’s. A mind-set that led to big falls in government intervention in the economy.
Why Measure the S&P 500 in Gold?
The last 80 years has seen prolonged cycles of appreciation and depreciation of the S&P 500 in gold. Equities depreciate during times of economic difficulty, although this may not always be obvious when priced in dollars, and appreciate during times of growth. We have witnessed 3 shorter periods of equity depreciation in gold and 2 longer periods of equity outperformance.
Perhaps the most amazing fact is that the S&P 500 in gold stood at 1.1 ounces on October 1928, giving us a price higher than the ratio today. There has been a long stream of dividends since then, but the real price of the equity market is lower today than the level of 84 years ago!
The Bear Markets
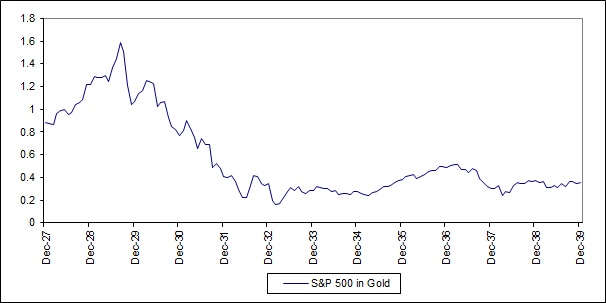
S&P 500 in gold: 1927-1939
Peak to fall: -90%
The S&P peaked in August 1929 at 1.58 ounces of Gold, before plunging 90% by February 1933 where it bottomed at 0.16 ounces. From there the equity market recovered somewhat back to 0.5 ounces. Unfortunately, this recovery was short-lived as the market halved again in the late 1930’s.
The 1930’s was in many ways a similar decade to our own. Politicians attempted to engineer a recovery through intervention and inflation in the early 30’s, which failed. In saying that, the politicians of the 30’s would balk at the scale of fiscal and monetary intervention being undertaken today.
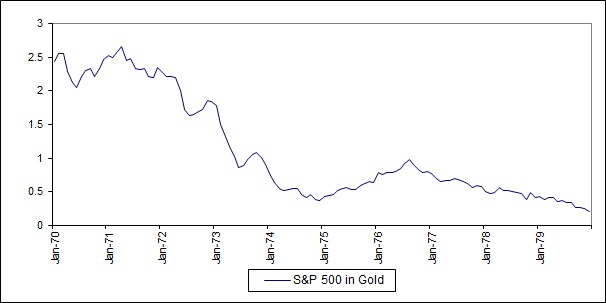
S&P 500 in Gold: 1970-1980
Peak to fall: -92%
The 1970’s is perhaps the most similar experience to today. The discipline of the Gold Standard was left behind, which opened the reins of politicians to try monetary and fiscal indiscipline. It failed; just as it is failing today!
During the 70’s bull-run in gold, the S&P 500 in gold peaked in April 1971 at 2.66 ounces. From there it was all downhill with a brief respite in 1975/76, when the S&P got back to 1 ounce of gold before falling back again. The peak to trough decline was 92%, with the market bottoming at 0.21 ounces at the end of the decade.
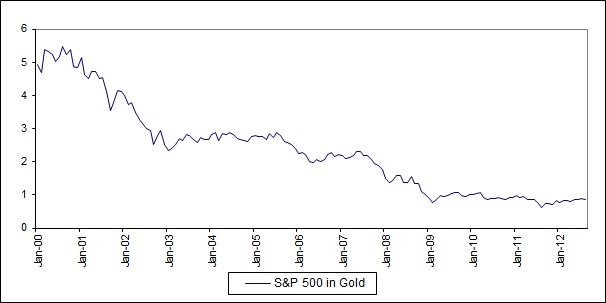
S&P 500 in Gold: 2000-2012
Peak to fall: -89%
The peak of the current market was reached in October 2000 at 5.4 ounces of gold. An intermediate low of 0.78 ounces was reached in February 2009 before a recovery was staged. However, much like the 1975/76 rebound, the S&P 500 has since fallen back and reached a new low of 0.62 ounces in August 2011. Thus far we have seen an 89% fall with scope for more.
The Bull Markets
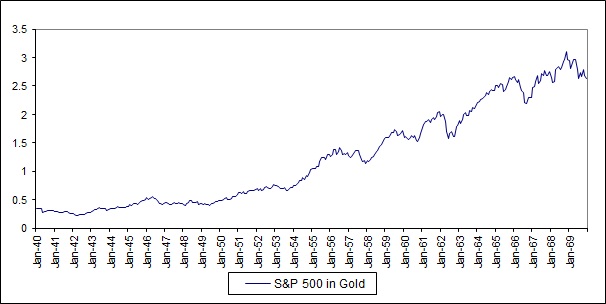
S&P 500 in Gold: 1940-1970
Fall to peak: +1200%
The bottom of the S&P 500 was reached in April 1942 at 0.22 ounces of gold, in the middle of WW2. A long bull run then followed with equities topping out in November 1968 at 3.1 ounces. The total trough-to-peak advance of the S&P 500 in gold was 1200%.
This was a grand era of prosperity. The monetary experiments and interventionism of the 1930’s were forgotten. However, indiscipline started to creep in during the 1960’s that would form the root of the problems in the 1970’s.
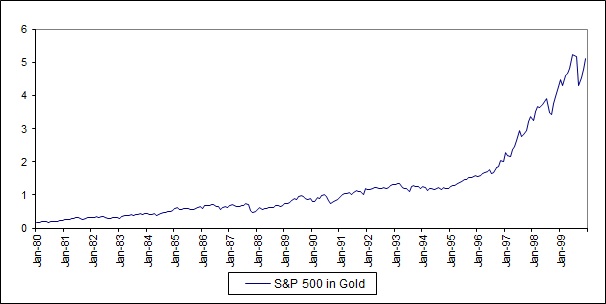
S&P 500 in Gold: 1980-2000
Fall to peak: +2300%
The S&P 500 bottomed out in January 1980 at 0.17 ounces and then advanced for the next 20 years, reaching a peak of 5.1 ounces in December 1999. The total trough-to-peak advance was 2300%.
The whole basis for the 20 year bull-run was monetary and fiscal reform that was undertaken in the early 1980’s. Politicians turned against inflation as a way to deal with economic problems and rolled back state intervention in the economy.
Conclusion
Re-basing the S&P 500 in gold reveals the true swings experienced in the equity market. These huge cycles have gone on for decades and been driven by political & economic decision making.
So what can we learn about previous cycles and apply to our current time? The current equity bear market began in 2000. At current valuation, the S&P 500 in gold still has scope to fall further. The cycle will only be brought to an end through a renewal of the entrepreneurial zeal of the early 80’s. A zeal which brought about big falls in government intervention in the economy.